Start typing a property address, then select the matching result.
Estimated 2027–28 Bond & Override Taxes
Tax type
Proposed (annual)
Existing (annual)
Total 2027–28
Bond
Prop 436 is added to existing
Prop 436
Estimated
annual
Override
Prop 435 replaces existing
Prop 435
2026–27replaced by Prop 435: replaced
annual
Property Details
Property detail
2026
2027
Assessed LPV
District Share
N/A
Bond and Override estimates utilize 2027 assessed values sourced from the
Maricopa County Assessor’s website. The existing-bond amount applies the 2026–27
existing-bond tax rate to the 2027 assessed value, since the 2027–28 rate has not been set.
The existing override shown is this property’s 2026–27 amount.
Property Details utilize assessed values, the district's net assessed value, and the assessment
ratio from 2026.
To verify your property’s assessed value, visit the
Maricopa County Assessor’s website.
To verify the district's net assessed valuations, visit the Assessed Valuations page on the
Maricopa County School Superintendent website.
To verify the estimated bond and override rates, visit the SMUSD90 Voter Information page on the
Maricopa County School Superintendent website.
Keep asking questions
Not sure about that number?
Pick the reaction closest to yours.
Does that number look too low?
The estimate above shows only the estimated 2027–28 bond and
override liabilities for this property.
Why does my school tax keep going up?
Is it the district spending more, or my property value going up?
Is the district spending the money well?
How much money the district receives and how well it’s spent are two different questions.
Three separate school charges, not one.
For this property, here is how the 2026–27 school-district portion
breaks down. These existing-year amounts provide context for the
proposed 2027–28 estimates shown above.
Estimated 2026–27 school-district total, per year$0
Worth knowing: your full county tax bill is larger
than this. It also funds the county, community college, fire, library
and other districts. Those are outside of the Saddle Mountain School District and are
not estimated here.
“I’m already paying the primary levy. What does that buy?”
This property’s estimated 2026–27 school primary levy is
$0 per year. It is the
largest school charge on most bills in this district.
Local
Primary levy
+
State
Equalization aid
The state-authorized funding for the district.
Supports day-to-day school operations, including:
Students and staff
Teachers, administrators, and support staff
Classroom instruction
Student services (health, counseling)
Student transportation
Materials, facilities, and services
Utilities (electricity, water, gas)
Textbooks and classroom supplies
Purchased services (trash pickup, insurance)
Custodial services and routine maintenance
Important distinction: the district’s base
operating budget authority is not calculated by adding up the actual
cost of these items. Arizona’s school finance formula determines
the authorized amount primarily from student counts, statutory
weights, and other formula components.
The levy counts toward that formula funding rather than adding
to it, so a higher local levy generally means less state aid, not a
larger operating budget.
That raises two different questions.
Why do school districts still ask for overrides?
The district's state-authorized funding calculation does not account for the actual costs of running the district.
1How the budget amount is set
Student Average Daily Membership (ADM)
The average number of students enrolled in the district each school day, generally counted over the first 100 days of the school year. It is the starting count of students the state formula pays for.
Student Weights
Each student is counted with a multiplier, or “weight,” based on grade level and needs such as special education or learning English. Students who cost more to educate count as more than one student in the formula.
The current (2027–28) weights can be viewed in Arizona Revised Statutes §15-943. You can also see weights in action on this site’s District Funding page with Build the Student. That tool uses FY2026 funding figures so they can be compared with the district’s actual FY2026 student expenses.
Teacher Experience Index (TEI)
A number that compares the average years of experience of the district’s teachers with the statewide average. Districts with a TEI above 1.00 receive an upward adjustment to their Base Support Level, the main part of the formula budget.
Transportation Support Level
State funding for getting students to and from school. It is calculated from the district’s approved daily bus route miles and the number of eligible students it transports, using per-mile rates set in state law. Large rural districts like ours drive a lot of miles.
School budget
Set by a state calculation
Not directly linked
2What the district has to pay for
A few examples. None of these costs are inputs to the state formula.
Teachers
Utilities
Cleaning
Maintenance
Supplies
And much more
Real costs
Driven by actual expenses
Real costs can change without the budget amount changing the same way.
The answer
An override lets local voters choose to fund more than the formula provides.
The state formula sets how much the district may budget based on student
counts and weights. It does not look at what it costs to hire and keep teachers
in this area, or at the staffing levels the community wants. If the formula
amount won’t support the teacher pay needed to compete with nearby districts,
or the number of teachers, aides, counselors or programs the district believes
students need, the district has two options: work within the formula amount,
or ask voters to approve an override.
An override is a time-limited local property tax, approved by voters, that lets
the district budget above the formula amount, up to a limit set in state law.
Whether that is worth the cost is up to voters. Your estimate above shows what it
would cost you, and the District Funding page
shows what the formula provides and how the district spends it, so you can judge
for yourself.
So what does the district actually receive to educate one student?
That question has a real answer, and it is worth checking rather
than assuming.
What would pay for school buildings if there were no bond?
There is not one automatic replacement fund for a bond. Eligible building and
equipment costs would have to fit within other capital sources, be put off or scaled back, or wait
for another funding source.
Unrestricted Capital Outlay (Fund 610)FY2027 budget: $2,137,492
The district’s general-purpose capital fund for items such as equipment, technology, vehicles,
building improvements and qualifying facilities work.
New School Facilities (Fund 695)FY2027 budget: $2,243,661
State facilities funding for qualifying new-school capacity. It is eligibility-based, not a locally
controlled substitute for any bond project.
Adjacent Ways (Fund 620)FY2027 budget: $2,301,314
Restricted to qualifying streets, sidewalks, utilities and similar access improvements serving school
sites.
Building Renewal Grant (Fund 691)FY2027 budget: $17,000
State grant funding for approved building-renewal projects; awards depend on project eligibility and
state approval.
Bond Building (Fund 630)FY2027 budget: $512,389
Remaining voter-authorized bond proceeds. Once those proceeds are exhausted, this source is gone unless
voters authorize additional borrowing.
The key distinction: the district’s day-to-day operating budget can’t simply
absorb a large construction program. Arizona accounts for building costs separately, and each source
above has its own limits and eligible uses.
What determines the district’s actual funding allocation?
Arizona’s funding formula starts with student counts and applies statutory
weights and other formula components to determine the district’s
authorized base funding (see A.R.S. § 15-943, “Base support level”). The District Funding tool lets you build a
student and see how those factors affect the amount.
Your school tax is your share of the total the district collects. So it
can go up if your share gets bigger, if the total
gets bigger, or both.
Your slice of the district—
×
Total school taxes collected—
=
Your school tax—
Try it: move a slider and watch your school tax change.
Whole pie: total collected
—Your slice: your school tax
—
Your slice is enlarged so it’s visible, but it grows and shrinks
in true proportion. The dashed circle is the actual 2026–27 pie.
Grows when your home’s value rises faster than the district’s total.
Grows with enrollment, state funding increases, and voter-approved bonds and overrides.
These are the actual 2026–27 figures.
From 2020–21 to 2026–27:
—Size of your slice
×
—Total school taxes the district collects
=
—Your school tax
Pick one to see what drove it:
Lever 1 of 2
Your slice of the district
Your slice is your home’s taxable value compared with all the taxable
value in the district. It grows when your value grows faster than the
district’s total.
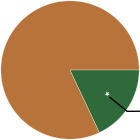
The district’s taxable value, 2026–27: $914 millionUtilities and other state-valued property — 82%Homes, businesses, farms and land — 18%This property
A single property’s slice is far too small to see at this scale.
You vs. the whole district
Growth since 2020–21. When your line climbs faster than the
district’s, your slice of the district is getting bigger.
This property’s taxable value (+5% a year)All taxable value in the district
When your value grows faster than the district’s
total, your slice gets bigger and you carry more of the bill.
Utilities make up most of the district and grow slowly, so homeowners’
slices have grown in most years. In 2025–26 the district’s total
value fell 2.6% while homes could rise 5%, so homeowners’
slices jumped about 8% in one year.
See each year for this property
School year
Your taxable value
District total
Your slice (% of district)
District school taxes
Your school tax
An estimate. Earlier years assume this property’s
taxable value grew the full 5% each year. That holds only while taxable
value is below market value, and not for homes built after 2020.
Lever 2 of 2
The number of students doubled. The tax base didn’t.
What the district collects is set mostly by the state’s
per-student formula, plus what voters approve. Divide it by all the
taxable property in the district and you get the tax rate. When
collections grow faster than property values, the rate goes up for everyone.
School tax rates (per $100 of taxable value)
All taxable value in the district
When total value dips (2025–26), the rate rises to collect the
same levy. When value grows faster than the levy (2026–27), the rate
falls. The jump in 2022–23 was the levy itself growing as enrollment rose.
2015–16 to 2026–27:
School taxes collected ($11.0M → $28.5M)+158%
All taxable property ($782M → $914M)+17%
More students, more state-set funding. About 83% of
the increase in collections is the local share of the state’s
per-student funding formula. Enrollment more than doubled, from 1,443
students in 2015–16 to 3,096 in 2025–26.
Voter-approved bond and override. The other 17% is the
2019 bond and 2020 override.
A tax base that barely grows. Utilities and other
state-valued property, mostly the electric utilities that co-own Palo
Verde Generating Station, make up about 82% of the district’s
taxable value for 2026–27. That value grew just 2.3% this year,
while homes and other local property grew 10.4%. Because utilities are
such a large share, the whole tax base grows slowly, so as the district
grew, the rate had to rise.
Spending grew with enrollment, not per student.
After adjusting for inflation, the district spends about the same per
student as it did in 2019–20: $13,367 then,
$13,316 in 2024–25 (in today’s dollars).
Total spending grew mainly because there are more students and prices
went up.
Where the added spending went (2019–20 to 2024–25):
Classrooms — the biggest increase
Teachers and classroom aides: about $10.6 million more a year.
+$10.6M
Student support — the fastest-growing
Services for students with disabilities, counselors, psychologists, and nurses. Nearly tripled.
+$4.2M
Administration — the smallest increase
Barely changed in dollars while enrollment grew by half.
+$0.15M
Worth knowing: the district doesn’t set its basic
budget by adding up its costs. The state formula sets it from student
counts, and the local tax pays part of that amount.
“More funding doesn’t automatically mean good spending.”
Agreed — those are two different questions, and this site keeps them
separate on purpose. One is about how much reaches the district. The
other is about what happened to it.
How much funding is available?
≠
How well is it spent?
Two questions, two places to look. Start with how the
funding is built, then use the bond project records to judge how those
dollars were actually used.
The property values and tax amounts shown by this tool are estimates
provided for general informational purposes only. They are not an
official tax bill or assessment and do not guarantee future
tax amounts.
The proposed bond and override estimates use the property's 2027
assessed value and the estimated tax rates published by the district.
The existing-bond estimate assumes the 2026–27 existing-bond tax rate continues in 2027–28.
The Property Details and existing-tax drill-down use 2026 values to show
your historical share of the district's net assessed value, which is not
yet published for 2027. Actual taxes may differ from these estimates.